
By Wade Abel, CG, Director of Gemological Services, AGS Laboratories
Do you remember the days before GPS when you needed a map to get from point A to point B? Having a guide to help provide that information was essential!
The diamond plot is like a map, a guide to the information about the features of a diamond. Plots are primarily used for two purposes. First, to be able to identify the diamond. Second, to illustrate what is being observed in the diamond, which provides information to justify the clarity grade assigned.
At AGS Laboratories, all diamonds submitted for grading need to be able to be identified in some way. If a diamond does not receive a plot, an inscription is required. Most of the time, however, a plot is created for representation on the document, even if the diamond gets an inscription.

Additionally, it is AGS Laboratories’ procedure to plot finish features (polish and symmetry) for diamonds to use as identification for diamonds receiving a clarity grade of AGS 0 (IF). All finish plots are used for internal use only and are not printed on our documents. Sometimes, we need to reference the finish plots when a client wants to repair a diamond to obtain a grade of AGS 0 Ideal® for polish and/or symmetry. To provide that guidance for our clients, we will plot finish features only for diamonds that receive a finish grade of AGS 1 (Excellent).
AGS Laboratories uses specific facet arrangement line drawings for each different facet arrangement that comes to the Lab for the plots. If there is not a facet arrangement line drawing for a fancy shape in our system, we create the line drawing for that arrangement and add it to our database.
We currently have over 3,400 different facet arrangements in our database representing multiple shape outlines. In addition, our proprietary plotting software allows us to plot the shapes of the characteristics freehand. This allows for an accurate representation of the shape, size, and location of the characteristics for future identification.
Here are some plotting guidelines that we follow:
- All diamonds must be clean before plotting.
- Diamonds are plotted while actively looking at them under magnification. Never from memory.
- The relative size, shape, and location of the characteristics are drawn on the plot. This allows the viewer to be able to identify the diamond more easily and visualize what contributes to the diamond’s grade.
- When plotting, the sections of the diamond are counted using the crown bezel and pavilion main facets (see illustration below). This helps to orient the diamond for the correct placement of the plotted symbols. Usually, the grade setting inclusion, or other characteristics, is used to designate the “#1” section. This helps re-orient the diamond if needed.
- If an inclusion reflects, appearing as multiple inclusions, only the actual inclusion is plotted in the location that best represents where it actually is. Although only the actual inclusion is plotted, its reflections may impact the clarity grade.
- Only what is required to be able to positively identify the diamond and justify the grade is plotted. This helps feature the grade setting characteristics and prevents the plot from becoming too cluttered. Comments are used, if needed, for non grade-settings or identifying characteristics.
- Most characteristics are plotted on the crown diagram. Characteristics are plotted on the pavilion diagram if they break the surface on the pavilion or are only visible from the pavilion view.
- Like the legend on a map, the Key to Symbols helps the viewer understand what was observed and plotted. The key is listed in order of impact on the clarity grade (see Key to Symbols illustration below).
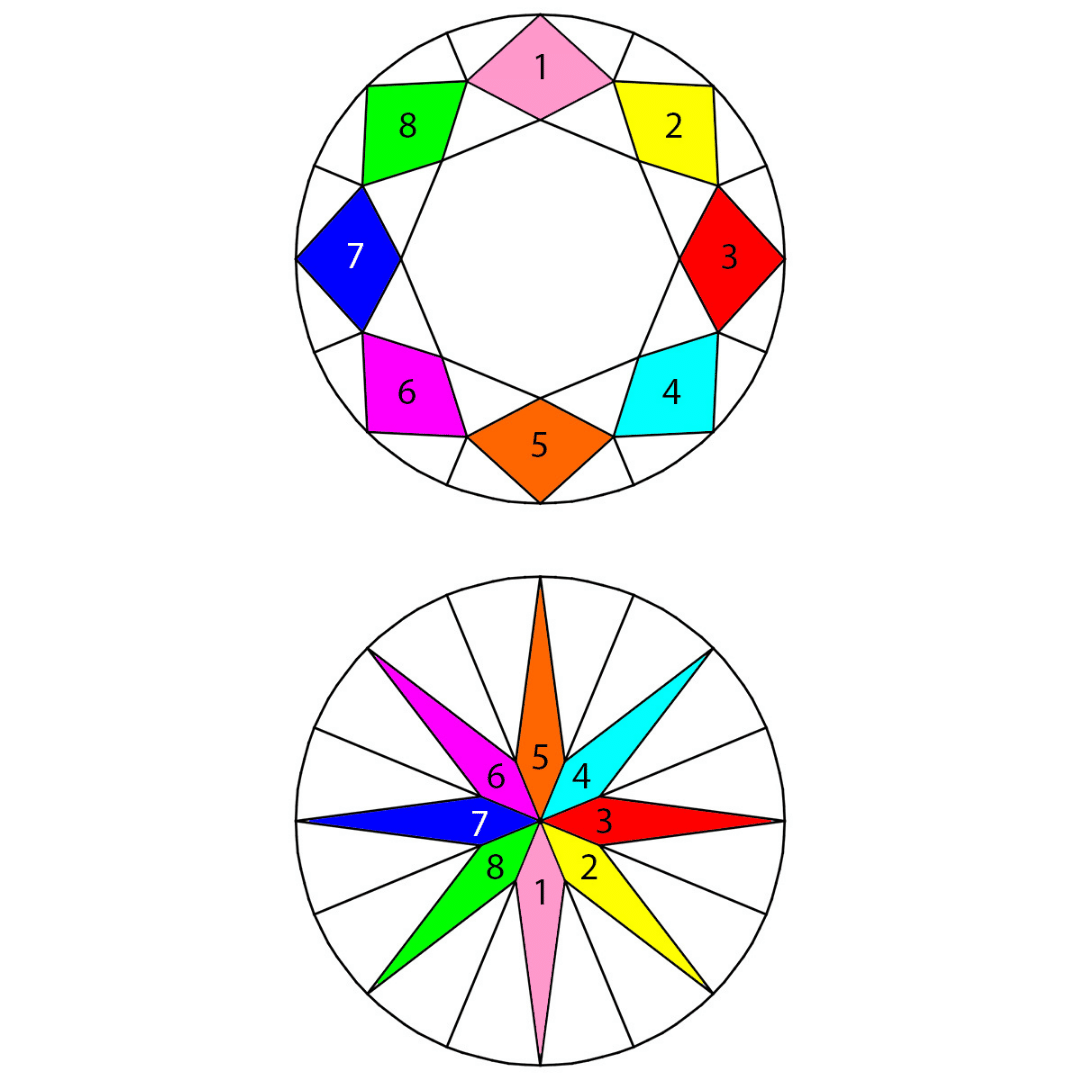
The corresponding crown bezels and pavilion mains on the plot are demonstrated here. It is as if you were to fold the paper or flip the diamond vertically to find the corresponding sections.
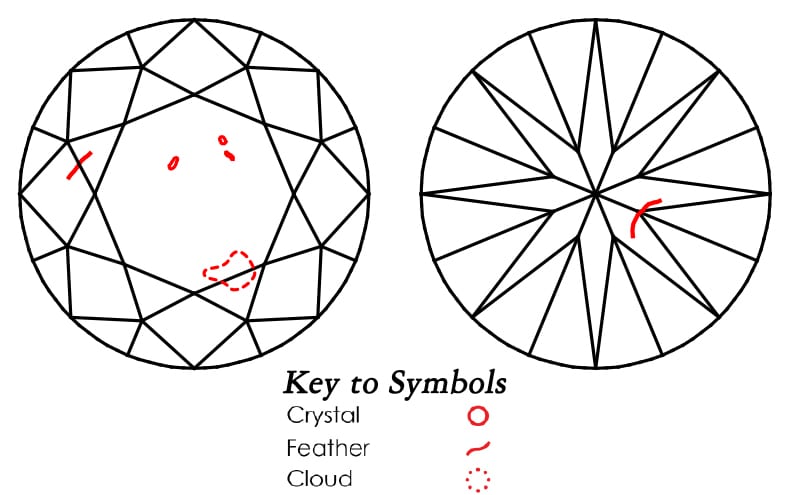
Sample plot of clarity characteristics with key to symbols
Three colors are used when plotting, red, green, and black.
- Red is used for most clarity characteristics.
- Green is used for polish characteristics.
- Black is used to represent symmetry features or extra facets. Extra facets are usually always plotted and are drawn where they are observed on the diamond.
Occasionally, some characteristics use both green and red in the symbol. Examples are Cavity, Indented Natural, Knot, or Laser Drill Hole. These demonstrate areas where the surface of the diamond is disrupted by a characteristic that penetrates into the diamond.
For diamonds graded at AGS Laboratories, the representation most seen by our clients is the clarity plot. Only if guidance has been provided for reworking a diamond (AGS 1 Excellent, only) will the polish and/or symmetry plotting symbols be relevant.
The three lists below demonstrate examples of the symbols used.
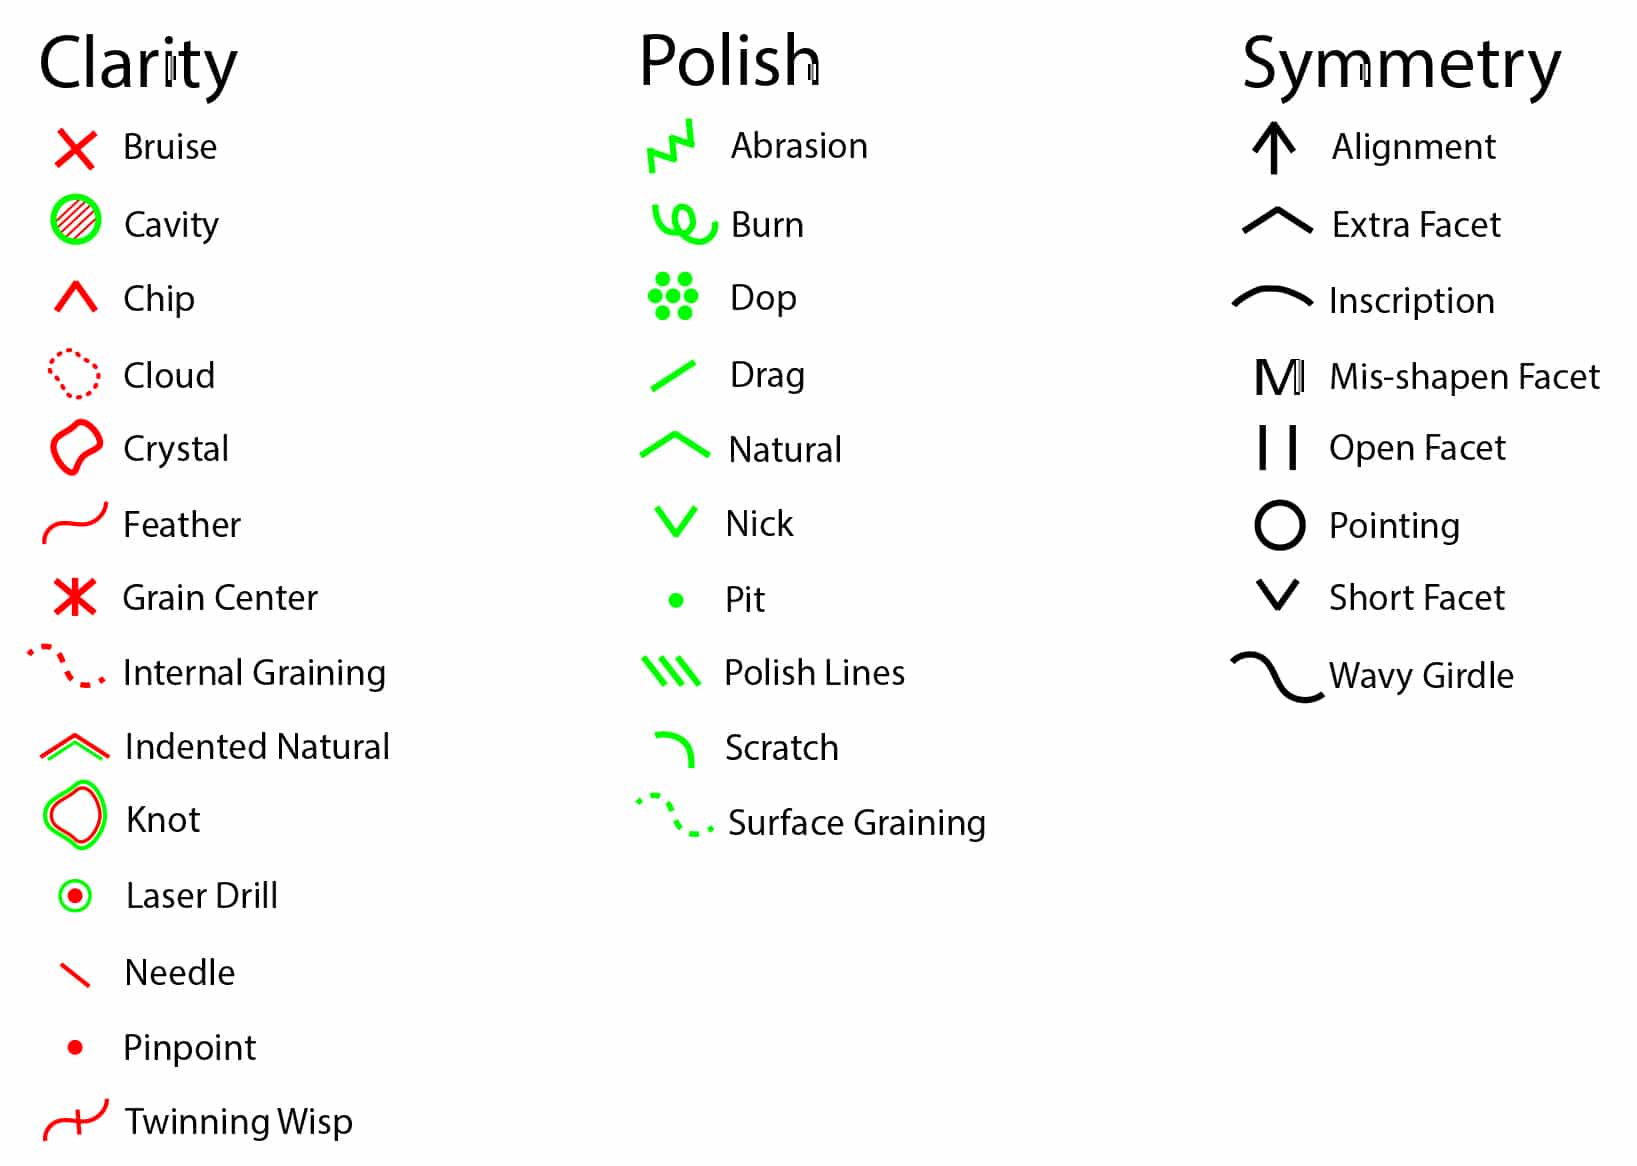
Symbols used to represent characteristics on a plot. Most of these symbols are drawn to represent the actual shape of the feature.
Comments are used on the document to further describe the diamond’s characteristics, for example, “Additional clouds not shown” can be used if there are multiple clouds, at least one cloud is represented on the plot, and there are enough plotted to identify the diamond and visually explain the grade. This type of comment can be used for clouds, pinpoints, or twinning wisps.
Think of a plot as the guide to the diamond. A map that provides so much information in one simple tool. After all, they say a picture is worth a thousand words!